Social and Emotional Data in Schools:
No Hype For Practical Results
Can social and emotional data truly transform school culture?
This question deserves careful examination, especially as more schools adopt climate measurement tools without clear strategies for using them effectively.
The Bold Claims About Social and Emotional Data
Edutopia published an article by Victoria Curry and Mike Setaro titled "Using Social and Emotional Data to Promote a Positive School Culture.”
The authors suggest that "the visual representation of this information and analysis can cause positive shifts in school culture" and that "highlighting warm data to support both relationships and social and emotional learning creates infinite possibilities and promise for our students."
These claims warrant scrutiny. Anyone familiar with organizational culture change knows it requires sustained effort with no guarantee of success.
The idea that simply visualizing social and emotional information could transform school culture seems unrealistic at best.

A Reality Check from the Field
At a recent ASCD conference in Chicago, I explored how schools actually use climate measures.
One principal demonstrated her Panorama dashboard, displaying an array of social and emotional data about her school.
When I pointed out that some measures appeared concerning, I asked what actions she planned to take. She had no answer.
This disconnect between data collection and meaningful action reveals a fundamental problem.
Schools are gathering social and emotional information without knowing how to use it productively.

Understanding the Hype Cycle for Social and Emotional Tools
The entrepreneurial world offers a useful framework for understanding this situation: the Gartner Hype Cycle.
This model describes how new technologies progress through predictable phases of public perception.
First comes the "peak of inflated expectations," where promoters make exaggerated claims about what the technology can accomplish.
The claims made by Curry and Setaro suggest social and emotional climate measures may be approaching this peak.
Next follows the "trough of disillusionment" as unrealistic promises fail to materialize.
Eventually, through the "slope of enlightenment," practitioners discover where the technology actually delivers value.
Finally, a "plateau of productivity" emerges where the technology serves its proper function reliably.
School leaders should recognize that social and emotional data collection represents a new technology with genuine potential.
However, wise administrators will aim for the plateau of productivity rather than riding the hype cycle's emotional waves.

The Vanity Metrics Problem in Social and Emotional Measurement
A second concept from entrepreneurship illuminates the challenge schools face: the distinction between vanity metrics and actionable metrics.
ProductPlan.com defines vanity metrics as "statistics that look spectacular on the surface but don't necessarily translate to any meaningful results." Examples include social media followers or video views.
These numbers may seem impressive but provide little guidance for improvement.
Consider how letter grades function in schools. A grade evokes feelings but rarely tells students how to improve poor performance or maintain good performance.
The social and emotional data shown on that principal's Panorama dashboard functioned the same way.
Without knowing what actions to take, the data becomes merely decorative.
Actionable metrics, by contrast, connect directly to specific behaviors that can change outcomes.
Rubrics exemplify this approach for student work. They describe what different performance levels look like, making improvement pathways clear.

Making Social and Emotional Data Actionable
How can schools transform social and emotional data from vanity metrics into actionable guidance? Self-Determination Theory (SDT) provides the answer.
SDT researchers have validated instruments measuring psychological need satisfaction, motivation patterns, and engagement levels.
More importantly, recent research has identified specific behavioral "do's and don'ts" scientifically proven to affect these measures.
This matters because SDT-based social and emotional measures connect to a clear causal model.
When principals understand which adult behaviors support or undermine student need satisfaction, they can take targeted action.
The same principles apply to how administrators support teachers, since these psychological factors operate universally across age groups.
Actionable Data Tool: Classroom Climate Formative Assessment
Reaching the Plateau of Productivity for Social and Emotional Climate Data
The encouraging news is that schools need not endure the full hype cycle.
Decades of scientific research have already established precise understanding of need satisfaction, motivation, and engagement psychology.
This same literature confirms how central these social and emotional factors are to deeper learning.
Rather than collecting impressive-looking dashboards of social and emotional data without clear purpose, schools can adopt measures grounded in SDT.
This approach provides both the data and the behavioral guidance needed to improve school climate systematically.
The path forward requires moving beyond inflated claims and overwhelming data displays.
Schools need social and emotional measurement tools that connect directly to evidence-based actions.
When administrators understand the causal relationships between adult behaviors and student experiences, climate data becomes genuinely useful rather than merely fashionable.
For school leaders seeking to improve their learning environments, the goal should be clear: skip the hype, avoid the disillusionment, and proceed directly to productive use of social and emotional climate data grounded in solid science.
To help you get clear on the difference between leadership and management read this next.
This article was printed from HolisticEquity.com
Sign up for the
Agentic Schools Newsletter!
Recent Articles
-
Host Schools Wanted
May 10, 26 12:25 PM
QuixotiCon is an EdCamp-style in-person unconference for local educators who recognize that nurturing children is the only true foundation for educating them. -
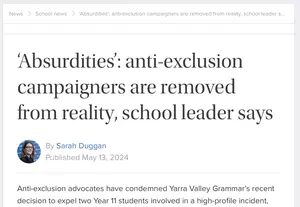
Is restorative justice removed from reality? Yes, sort of.
Mar 21, 26 02:22 PM
 Restorative justice is delusional when it is embedded in bureaucracy without carefully maintained protections from the meddling of bureaucrats.
 -
Defense Against The Dark Arts Course Interest Page
Mar 13, 26 02:42 PM
 The Defense Against the Darks Arts course for distinguishing education from indoctrination is in development, learn more here.